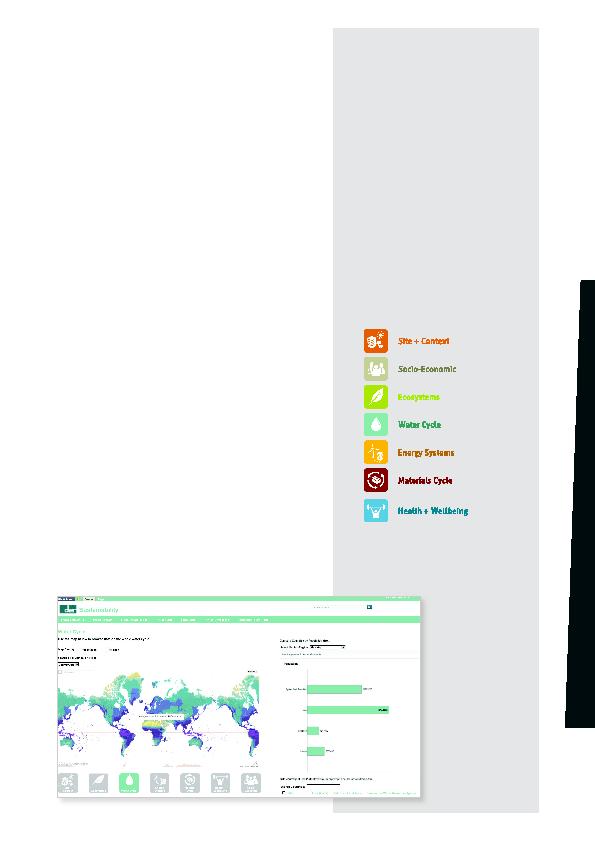
the Sustainability Portal have been
categorized according to the headings
listed below. These categories have
been developed to reflect the nature of
Dar's design projects while being in line
with the categories of the most popular
sustainability ratings systems.
this categorization encourages a wider
adoption of the integrated design
process as it requires collaboration and
communication across different design
disciplines of project teams.
Insidar intranet portal--is meant to be the first point of call for
sustainabilityrelated issues by staff from all disciplines, and at
all project stages. Yet, it should be considered complementary
to the advice provided by sustainability consultants across Dar
AlHandasah. In addition, the Sustainability Portal is not designed
to supplant existing data sharing and analysis services but to sit
alongside them and help coordinate the process among design
teams. The Sustainability Portal is divided into five main sections:
Analysis Map, Project Map, Dar Capabilities, Standards & Regulations,
and Research & Training.
of call for carrying out initial research and analysis, especially at
concept or schematic design stages. Using a familiar map interface, a
wide range of data sources can be overlaid to compare sustainability
metrics across cities and countries and at a global level.
compared, in order to aid designers in understanding the broad
socioeconomic and environmental constraints and opportunities of the
context in which they are designing. These datasets can be displayed in
a variety of graphical formats to allow the user to download resources
ranging from a complete set of average climate graphs to macro
socioeconomic data of major cities within a specific country.
projects, especially at the initial design stages when integrating
sustainability into the site analysis is most crucial. This analysis can also
identify unexpected factors that can become major drivers in a project's
development. It can also result in a more environmentally responsive
design. For example, during the Suez Canal Area Development project,
an analysis of average precipitation levels on a map during early design
stages identified a significant difference in rainfall between north and
south of the Suez Canal. This led to three separate sets of passive design
recommendations in response to this variation.
as a navigation and analysis
tool. Screen shot includes
the map interface with
overlaid precipitation
levels.