i9 |
Water-conserving irrigation in Saudi Arabia
20
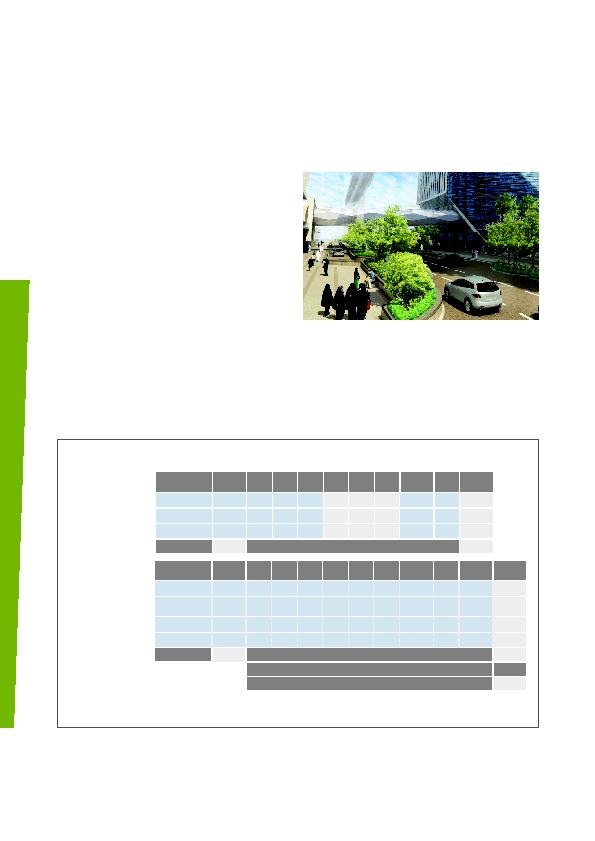
Figure 4 Parcel 2.11 recalculated to LEEDrecommended species with KL method applied
Agriculture vs. landscaping
Agriculture and landscaping are two very different fields. In
agriculture, one plant species is planted in the same density
pattern, row after row, and grown in an extensive and uniform
microclimate. In landscaping, many plant species are planted
in tandem, often in highly varying densities, and grown in
significantly changing microclimates created by the varying
landscape features.
The Landscape Coefficient (KL) method: a formula for
reducing irrigation water requirements
Rather than crudely applying a maximal water requirement rate that
overestimated the parcels' real watering needs, Dar's team turned to
something called the Landscape Coefficient method, or KL factor.
The KL factor predicts, during the design stage, the volume of
water required for a given landscape area. KL calculations help
cut down on unnecessary water applications.
ET
L
= K
L
x ET
o
Landscape Evapotranspiration = Landscape Coefficient x Reference
Evapotranspiration (1)
Where:
K
L
= k
s
x k
d
x k
mc
Landscape Coefficient = species factor x density factor x microclimate factor (2)
By applying the KL method in estimating the landscape plantings
water requirements of the KAFD three parcels, Dar's team ensured
that enough water and no more would go towards maintaining
the plants' health, appearance and growth.
Collectively, landscaping's unique
factors need to be accounted for when
estimating water needs. The Landscape
Coeffi cient (KL) formula enables that
process.
Reference evapotranspiration rate (ETo): 18.3
LANDSCAPE
TYPE
Area
(sf)
ks
kd
kmc
1
K
L
ET
o
ET
L
Irrigation
Type
IE
TWA
(Gal)
GROUND COVERS
689
0.5
1
1.2
0.6
18.3
10.98
Drip
0.8
5,894
SHRUBS
3,251
0.5
1
1.3
0.65
18.3
11.9
Drip
0.8
30,142
MIXED
2,137
0.5
1.1
1.4
0.77
18.3
14.09
Drip
0.8
23,460
Total area
6,077
Baseline total potable water applied (TPWA) (gal)
59,496
LANDSCAPE
TYPE
Area
(sf)
ks
kd
kmc
1
K
L
ET
o
ET
L
Irrigation
Type
IE
CE
TWA
(Gal)
SHRUBS(L)
3,251
0.2
0.5
1.3
0.13
18.3
2.38
Drip
0.9
1
5,359
GROUND COVERS
(L)
689
0.2
0.5
1.2
0.12
18.3
2.2
Drip
0.9
1
1,050
MIXED (L)
237
0.2
0.6
1.4
0.17
18.3
3.11
Drip
0.9
1
510
MIXED (M)
1,900
0.5
1.1
1.4
0.77
18.3
14.09
Drip
0.9
1
18,540
Total area
6,077
Design total water applied (TWA) (gal)
25,459
Nonpotable water used (gal)
25,459
Design total potable water applied (TPWA) (gal)
0
Percentage reduction of potable water:
100 %
Percentage reduction of total water:
57.21%
TABLE 1
IRRIGATION
BASELINE CASE
(JULY)
TABLE 2
IRRIGATION
DESIGN CASE
(JULY)
Figure 3 The team picked low to medium waterdemanding plant species