- Page 1
- Page 2
- Page 3
- Page 4
- Page 5
- Page 6
- Page 7
- Page 8
- Page 9
- Page 10
- Page 11
- Page 12
- Page 13
- Page 14
- Page 15
- Page 16
- Page 17
- Page 18
- Page 19
- Page 20
- Page 21
- Page 22
- Page 23
- Page 24
- Page 25
- Page 26
- Page 27
- Page 28
- Page 29
- Page 30
- Page 31
- Page 32
- Page 33
- Page 34
- Page 35
- Page 36
- Page 37
- Page 38
- Page 39
- Page 40
- Page 41
- Page 42
- Page 43
- Page 44
- Page 45
- Page 46
- Page 47
- Page 48
- Page 49
- Page 50
- Page 51
- Page 52
- Page 53
- Page 54
- Page 55
- Page 56
- Page 57
- Page 58
- Page 59
- Page 60
- Page 61
- Page 62
- Page 63
- Page 64
- Flash version
© UniFlip.com
rainfall riddle | i8
Storm duration (min) Bell / SCS ratios TRMM ratios Modified Bell’s ratios
5 0.139
15 0.239
30 0.343
60 0.435
120 0.565
180 0.626 0.7
360 0.750 0.84 0.840
720 0.877 0.92 0.920
1440 1.000
0.156
0.267
0.384
0.486
0.632
0.700
1.000
Table 1 Ratios between 24-hour duration intensity and other storm duration intensities
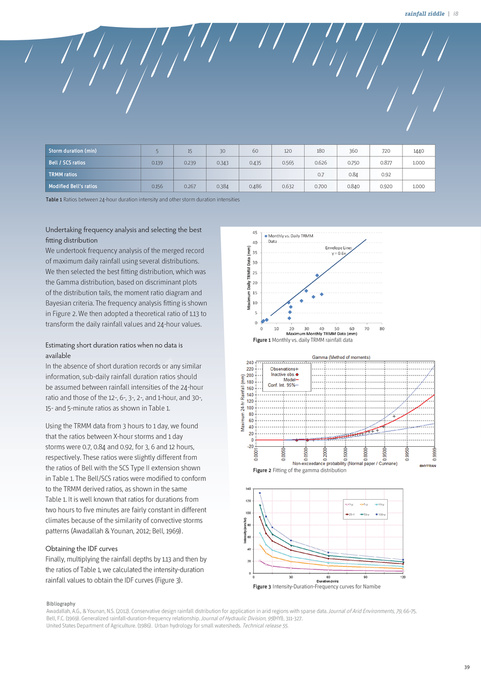
Undertaking frequency analysis and selecting the best fitting distribution We undertook frequency analysis of the merged record of maximum daily rainfall using several distributions. We then selected the best fitting distribution, which was the Gamma distribution, based on discriminant plots of the distribution tails, the moment ratio diagram and Bayesian criteria. The frequency analysis fitting is shown in Figure 2. We then adopted a theoretical ratio of 1.13 to transform the daily rainfall values and 24-hour values. Estimating short duration ratios when no data is available In the absence of short duration records or any similar information, sub-daily rainfall duration ratios should be assumed between rainfall intensities of the 24-hour ratio and those of the 12-, 6-, 3-, 2-, and 1-hour, and 30-, 15- and 5-minute ratios as shown in Table 1. Using the TRMM data from 3 hours to 1 day, we found that the ratios between X-hour storms and 1 day storms were 0.7, 0.84 and 0.92, for 3, 6 and 12 hours, respectively. These ratios were slightly different from the ratios of Bell with the SCS Type II extension shown in Table 1. The Bell/SCS ratios were modified to conform to the TRMM derived ratios, as shown in the same Table 1. It is well known that ratios for durations from two hours to five minutes are fairly constant in different climates because of the similarity of convective storms patterns (Awadallah & Younan, 2012; Bell, 1969). Obtaining the IDF curves Finally, multiplying the rainfall depths by 1.13 and then by the ratios of Table 1, we calculated the intensity-duration rainfall values to obtain the IDF curves (Figure 3).
Figure 1 Monthly vs. daily TRMM rainfall data
Figure 2 Fitting of the gamma distribution
Figure 3 Intensity-Duration-Frequency curves for Namibe
Bibliography Awadallah, A.G., & Younan, N.S. (2012). Conservative design rainfall distribution for application in arid regions with sparse data. Journal of Arid Environments, 79, 66-75. Bell, F.C. (1969). Generalized rainfall-duration-frequency relationship. Journal of Hydraulic Division, 95(HYI), 311-327. United States Department of Agriculture. (1986). Urban hydrology for small watersheds. Technical release 55.
39